Now is the time for investors to rotate out of the public markets into Canadian Farmland

Now is the time for investors to rotate out of public markets into Canadian farmland

  • Article by: Tom Eisenhauer, ICD.DPresident & CEO at Bonnefield Financial Inc.
    The current market environment is creating a dilemma for investors. On one hand, the economic picture remains bright: corporate earnings appear strong, unemployment is low and inflation, while rising, remains benign. On the other hand, warning signs abound:
  • We are in the midst of one of the longest bull markets in history: stock markets have enjoyed a 10-year upward run with few interruptions.
  • Stock prices, by almost any measure, are more expensive than they have been at any time in history other than just before the 2001 “Dot Com” crash.
  • Bond yields are rising, and interest rates are headed up (which is bad for stock prices).
  • Individual debts are at all-time highs and, more worryingly, margin debt (debt borrowed to buys stocks) is at unprecedented levels.
  • Bitcoin, blockchain and cannabis stocks are clearly in speculative bubbles.
  • Geo-political and international trade uncertainties abound, and (to put it mildly), the response of world leaders to any potential shock cannot be predicted.

In the last 34 years we have experienced five significant bull-market runs, four of which ended in large stock market declines or crashes. The first began in 1984 and ended on Black Monday in October 1987. The second started in 1994 and ended with the Asian Flu currency crisis in September 1998. The third began in late 1998 and ended in the Dot Com bust of 2001. The fourth started in March 2003 and ended with the Global Banking Crisis of 2008, and the fifth began in March 2009 and has continued until today, more or less uninterrupted for much of the past decade.

Just how exceptional has our current bull market been? Figure 1 provides some context. The previous 4 market cycles lasted an average of 29 months and saw the S&P 500 rise by an average of 97%. In comparison, our current bull market run has, so far, lasted an incredible 107 months and seen the S&P 500 rise by 354%

Figure 1: our current bull run is the longest in decades…

Figure 2: …and it takes a long time to recover after long bull runs

As Figure 2 indicates, it typically takes a long time to recover losses incurred in stock market crashes that have followed long bull runs. In the previous four cycles, the recovery period (ie. the length of time it took to fully recover the losses incurred from market declines) lasted 77% as long as the preceding bull market run – an average of 43 months. Recoveries from the Dot Com and Global Financial Crisis took significantly longer – 81 and 65 months respectively.

Simply put, it took between 5.5 and 6.7 years for investors to make up the losses they incurred in the previous two stock market declines.

What conclusions can we draw from these historic patterns?

  • We are surely in the latter stages of one of the longest bull markets in history, and the longer it goes on, the greater the risk of a significant decline.
  • At current equity valuations, future market gains will, almost certainly, be less than those of recent years and with interest rates increasing, bond returns are likely to decrease from recent levels as well.
  • As the prospect of further returns diminish, market risk is increasing – creating a poor risk/return outlook for both stocks and bonds.

Figure 3 illustrates how the current risk/return pattern has significantly changed from the past few decades. Using historic annual returns since 1990 for the S&P 500 and 10-year Treasury Bonds (all figures in US dollars without currency conversion into CAD), we estimated the stock-and-bond portfolio mix that would have produced a similar 10% total return as that generated by Canadian farmland over the same period.

Posted in Uncategorized | Comments Off on Now is the time for investors to rotate out of the public markets into Canadian Farmland

USA Land value increases by 3% in 2017

January 17, 2018 (Chicago) – The Realtors® Land Institute and National Association of Realtors® Research Department released the results of their annual Land Markets Survey which shows a 4 percent increase in land sales and a 3 percent increase in land prices over the previous twelve months.

Sales for all types of land rose, indicating a strong national land market. In the lead were residential land sales with an increase of 5 percent, followed by commercial land sales up by 4 percent. Analysts in the NAR Research Department and at RLI believe these markets are in the lead because of the sustained economic growth and the continued recovery of the housing construction market due to an increase in new home sales.

Land sales for agricultural irrigated land also rebounded after contracting last year, as commodity prices generally stabilized from late 2016 to early 2017 after slumping since 2014. Responses from survey participants indicated a lack of land financing, tighter zoning regulations, and valuation issues as some of the biggest issues facing the industry.

RLI’s 2018 National President Jimmy Settle, ALC, said “Now is great time for landowners and investors as well as land professionals. With flat commodity prices making the growth in ag land sales modest compared to residential and commercial land sales, it’s encouraging to see the market as a whole still continue to strengthen.”

The annual Land Markets Survey is a tool for landowners and land real estate professionals in all sectors of the business to use for bench-marking and as an informational resource when conducting business. This year marks the fifth consecutive year that the survey has been conducted to reveal current trends and the ever-changing state of land markets within the industry; and with over 800 respondents this year, it continues to grow. The Realtors® Land Institute has made the full survey results available for free to the public on their website at rliland.com/about-realtors-land-institute/land-markets-survey

Posted in Uncategorized | Comments Off on USA Land value increases by 3% in 2017

Renting or Leasing land

Renting, Leasing or Crop sharing your land or farm is more and more common in Canada.

According to the latest data from Statistics Canada’s 2016 Census of Agriculture, farmersin Western Canada are renting more and more land. In Manitoba, farmers rent or lease 33 per cent of the farm / land, in Saskatchewan 28 per cent and in Alberta 42 per cent.  They are are not all paying the same rental rates and they don’t all have the same rent or lease agreements.

How do farm & land owners and renters come to an agreement that provides security for the tenant, gives the landowner the return he or she needs, and encourages good management & stewardship of the land , buildings and/or equipment. ?

Renting or Leasing land resources.


Posted in Uncategorized | Comments Off on Renting or Leasing land

2016 Canada Farmland Values: Looking at the numbers

By Farm Credit Canada

Farm Credit Canada land value report video

Video Highlights

  • The 2016 national average in farmland values increased by 7.9%
  • Multiple signs show farmland values increases slowing down
  • Most significant increases occurred in P.E.I, Alberta and Nova Scotia
  • Healthy Canadian ag sector and low CDN dollar help sustained the increase
  • Available land and actual demand still the most important drivers in the marketplace
Posted in Uncategorized | Comments Off on 2016 Canada Farmland Values: Looking at the numbers

2017 USA cropland value by state in dollars per acre and change from 2016

2017 USA cropland value by state in dollars per acre and change from 2016


Posted in Uncategorized | Comments Off on 2017 USA cropland value by state in dollars per acre and change from 2016

USA Farmland prices for crop land staying the same and pasture/ranch land showing increases


Average USA crop land values staying the same year over year.

Average USA total land values show slight increase

Posted in Uncategorized | Comments Off on USA Farmland prices for crop land staying the same and pasture/ranch land showing increases

Land investment available

Currently 320 acre land for sale in Alberta with 3% annual return.

270 acres cultivated and 50 acre’s native grass

Call Ben @ 403.393.4040

ben@theboss.ca


Real Estate Centre

Posted in Uncategorized | Comments Off on Land investment available

What do farmland values in Canada, Australia and the U.S. have in common?

Article by FCC Canada

Canada, Australia and the U.S.: Three countries. Three agriculture industries. Each is a global ag powerhouse, exporting some of the world’s largest ag commodity values, and they compete directly with each other. Despite their similarities, together they show how the same economic drivers can produce entirely different patterns in farmland values’ growth rates.

Here’s how.

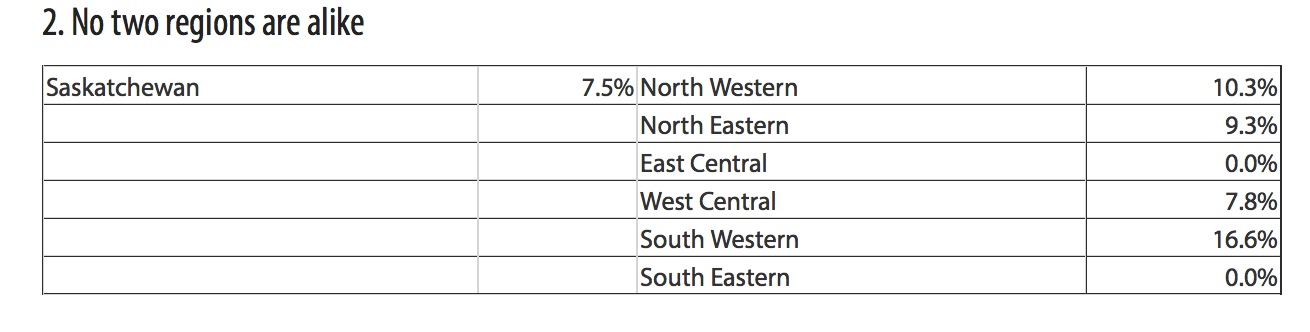
Patterns in growth of farmland values differ

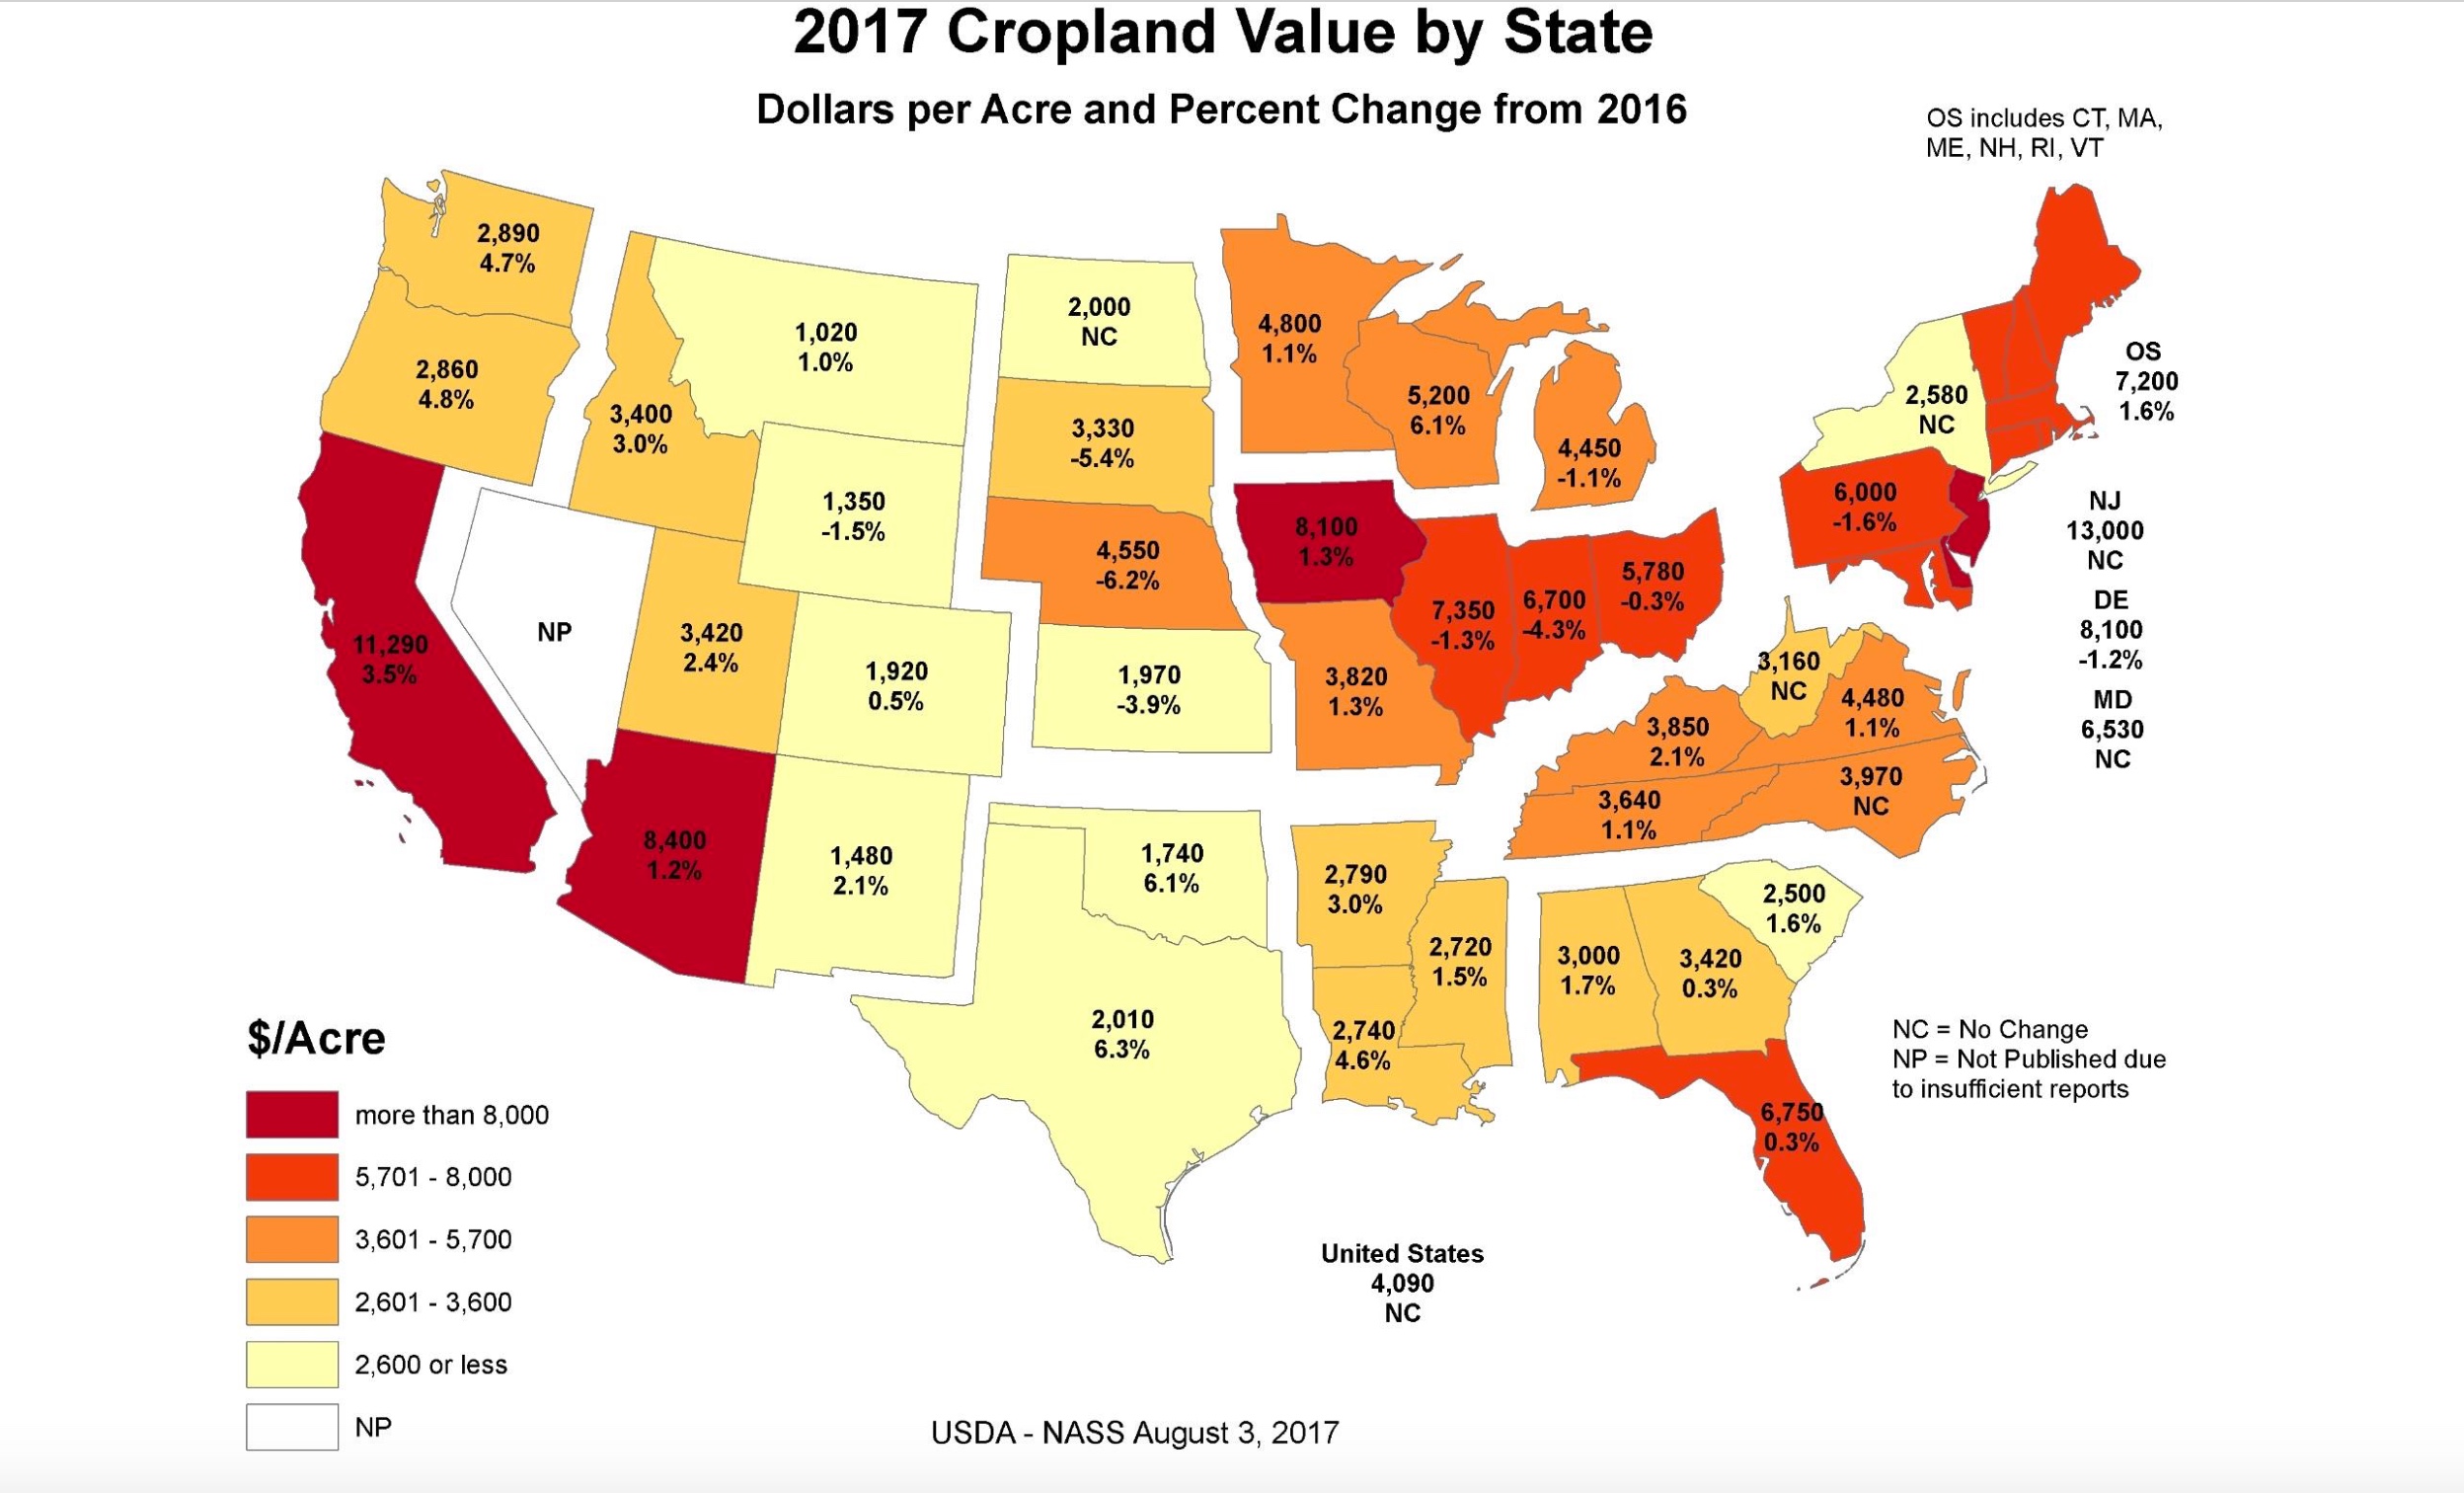
All three markets saw their farmland values increase at least once over the last three years, but at rates of growth, and in patterns, that differed dramatically. Both Australia and Canada saw only growth over the last three years, while U.S. values, which fell for five consecutive quarters, now appear to have halted their slide.

Different outcomes – but the same drivers behind farmland values

We’ve often repeated that farm income and interest rates are the two most important drivers of farmland values. Given that, it’s not hard to see why values have increased in all three countries. Each Central Bank’s key interest rate has been trending down for several years. Despite recent upward pressures on borrowing costs in the U.S. and Canada, they remain near historical lows. A tight inventory of available farmland has also resulted in strong purchase bids and higher average prices.

But farm income matters most.

Canadian net cash income (NCI) reached a record-high CA$15.7 billion in 2016. It’s grown 23.7% since 2014. The net value of agricultural production in Australia also peaked during the 2015-16 marketing year, having increased by a double-digit rate in the last 3 years.

The U.S. was different. Net cash income declined by a whopping one-third, falling from US$135.6 to US$91.9 billion, between 2013 and 2016.

The stronger USD is one of the biggest culprits in explaining the divergence among the three markets. In fact, the year-to-date average value of the loonie relative to the USD is 15% below its 5-year average. The Aussie dollar has depreciated 14% vs the USD at the same time.

Canadian agriculture is healthy right now, in part because of the recently devalued loonie. We expect it to average US$0.75 for the remainder of the year which, if correct, will support further NCI growth. Now, while the economics are good, is the best time to go over your marketing plans and build contingencies for the days when the market will trend in a different direction.

Posted in Uncategorized | Comments Off on What do farmland values in Canada, Australia and the U.S. have in common?

Farm Credit Canada 2016 farmland value report

2016 farmland values in Canada: 3 things you should know

Canadian farmland values increased at an average annual rate of 7.9% in 2016. While farmland values continue to strengthen, their rate of growth continues to slow overall. This is the third consecutive year the overall rate of increase declined year-over-year. Average farmland values in Canada increased 22.1% in 2013, 14.3% in 2014, and 10.1% in 2015.

Here are my three takeaways from the 2016 FCC Farmland Values Report. PDF (2.7 MB)

 1. Growth in farmland values slows

2016 farmland values increased in every province (except Newfoundland and Labrador, where a lack of data precluded analysis), with increases ranging from 1.9% (New Brunswick) to 13.4% (PEI). However, the rate of growth slowed for the third consecutive year in Saskatchewan, and for the fourth successive year in Quebec and Ontario. A slowdown in the rate of appreciation at a time when crop receipts show signs of levelling out is a step in the right direction. It helps to keep farmland accessible for producers wishing to expand.

The only province showing signs of a steadily faster appreciation in 2016 was British Columbia, where urban pressures combined with the province’s unique market opportunities resulted in the highest regional farmland value increase in Canada. Farmland values in Nova Scotia and PEI also rose more than they did in 2015.


Of the 51 regions reported in the FCC studyPDF (3.6 MB) seven show no annual change. Eight regions recorded an average annual increase larger than 10%. British Columbia, New Brunswick, Quebec and Saskatchewan have greater variation across regions, with some showing little year-over-year variation next to regions with strong year-over-year variation.

3. Income and interest rates: Consistent drivers of Canadian farmland values

Healthy farm incomes helped drive up farmland values. Tallies for 2016 farm cash receipts aren’t yet available, but we expect crop receipts grew 2% from 2015 – or 10% above the average of the 2011-2015 period. This was thanks to a low loonie, which helped to strengthen demand for Canadian ag products and soften the impact of weather-related production issues in the west.

Low interest rates also support growth in farmland values. The effective business interest rate of the Bank of Canada steadily declined throughout 2016, reaching a record-low in the last quarter of 2016.

Sustaining farm income is essential to support farmland values

Our next blog will feature what we think about long-term prospects for farmland values.

Posted in Uncategorized | Comments Off on Farm Credit Canada 2016 farmland value report

Growth slows for Canadian farmland value amid declining field-crop prices

Growth slows for Canadian farmland value amid declining field-crop prices ERIC ATKINS The Globe and Mail Published Monday, Apr. 10, 2017 12:01AM EDT Last updated Monday, Apr. 10, 2017 12:01AM EDT

The surge in the value of agricultural real estate is cooling along with crop prices and farm revenues.

Average farmland values rose by 8 per cent in 2016, down from 10 per cent in 2015 and 14 per cent in 2014 according to Farm Credit Canada, the Crown corporation that is Canada’s biggest lender to farmers.

The biggest driver of the decline in growth is lower global prices for field crops, said J.P. Gervais, chief agricultural economist at FCC.

Prices for major Canadian crops including wheat, canola and corn have fallen from their peaks in 2013 and 2012 amid big global harvests and swelling stockpiles.

“We’ve had tremendous growth for the last 10 years, very significant growth. We’ve basically doubled crop receipts mostly across the country,” Mr. Gervais said on a conference call with reporters.

“But I think it would be a little unrealistic to think that the next 10 years will be like the last 10 years.”

Prince Edward Island saw the largest price increase in 2016 of 13.4 per cent, followed by Alberta at 9.5 per cent.

On a regional basis, British Columbia’s South Coast is Canada’s hottest market. The area, which includes the Fraser Valley, posted price increases of 17.7 per cent. This was driven by a large number of sales in the first part of the year as local farmers expanded and residential buyers sought rural properties, according to FCC’s annual report on farmland values, which does not report values in dollar amounts.

Aaron Goertzen, an agricultural economist with Bank of Montreal, said Canadian farmland and city real estate prices have soared for the same reason: low borrowing costs. He notes farm values continued to rise even after commodity prices started falling in 2012.

Canadian farmers, who export most of their grains, have avoided the revenue declines of their U.S. counterparts because the low Canadian dollar has cushioned them against lower crop prices. “That low loonie has propped up farm earnings so people are still willing to pay more for land,” Mr. Goertzen said by phone.

However, Mr. Goertzen warned interest rates look set to begin climbing, and the dollar will follow, nudged higher still by rising commodity prices. “I would expect to see farm prices slow further in the coming years so it’s not going to be, in my view, a bounce back to these really strong, unsustainable growth rates of 10 per cent that we saw for more than a decade,” Mr. Goertzen said. “I think the boom is certainly over, and the question now is what the adjustment to the new normal looks like.”

An acre on the average Canadian farm doubled in value between 2005 and 2015, to $2,700, including the buildings, according to Statistics Canada.

Ontario leads the list, at $10,000 an acre, followed by B.C. at $5,450 and Quebec at $5,100.

Restrictions on farmland purchases by foreign and institutional buyers vary by province, although B.C. and Ontario have no limits.

Mr. Gervais says he doubts foreign competition for agricultural real estate has had much of an impact on values, and says most sales are between producers. “At the end of the day, the supply of land remains quite limited,” he said.

Report Typo/Error
Follow Eric Atkins on Twitter: @ericatkins2

Posted in Uncategorized | Comments Off on Growth slows for Canadian farmland value amid declining field-crop prices